If you’ve ever had any performance issues with your .NET applications, you may find this writing interesting.
In this post I’d like to present to you a tool produced by JetBrains – dotTrace, showing how using only one of its functionalities can help in finding causes of performance issues in .NET applications.
Performance issue on production
Months ago some of your colleagues implemented an application and delivered it to the Customer. The app is “Countries and Cities Manager”, which is used by some administrator working in local government unit. That’s how it looks:

That’s cool, isn’t it ? This “administration panel” allows to add a new city to the country. User fills name of the city and provides ISO code of the country considered. You may think “who would ever use it and for what?”. True. But first of all, this is just an example 🙂 , and secondly, imagine that Russia annexes some big European country. What happens then ? User administrating local government system must use your manager application to insert hundreds or thousands of new cities in Russia. Gotcha!
The next day you receive a ticket in your company’s issues tracking system. Taking into consideration that an average number of cities in east-European countries is ~600, the ticket’s priority is set to “Blocking”. The description of the issue is:
- User fills the “City” and “Country ISO Code”, clicks “Add city”
- Waits for 10 seconds…
- Waits for 20 seconds…
- Waits for 30 seconds…
- Error message received:

ISO not found - User corrects “RU” to “RUS”
- Waits for 10 seconds…
- Waits for 20 seconds…
- Waits for 30 seconds…
- City added!
- Scenario repeats for each new city to be added. Performance is unacceptable.
Initially you have no idea what could be the reason. Such simple operation and such terrible performance? Let’s see…
Looking for issue with dotTrace profiling
In such cases, especially if I don’t know the code of the application considered, the very first thing I do it to use dotTrace in order to profile the application when executing bad-performance actions. It provides many features, including:
- detecting performance bottlenecks in .NET applications
- getting information about calls execution times
- analyzing calls order on a timeline
- profilling SQL queries and HTTP requests
- profiling unit tests
- … and many more.
We will use only the simplest profiling mode which is called Sampling.
After you downloaded and installed dotTrace, launch the application you want to profile first. Then, launch dotTrace and in Attach to Process section find and select process of your app and select Sampling mode:

Then, click “Run” button just below Sampling mode selection – you’ll see the profiling session has started:

Next, go to your application and execute bad-performance action. In our case, we click on “Add city” button:

App is not responding – cool! Now we wait those 10, 20, 30 seconds until we get the error message described by the user. To be sure what’s happening, we can click the button few more times (maybe the next executions are better?). I clicked it 3 times are the times were pretty the same.
That’s the end of our bad-performance action, so in dotTrace session’s window click “Get Snapshot and Wait”:

After few seconds, JetBrains dotTrace Performance Viewer opens. Open “Threads Tree” on “All Calls” tab:
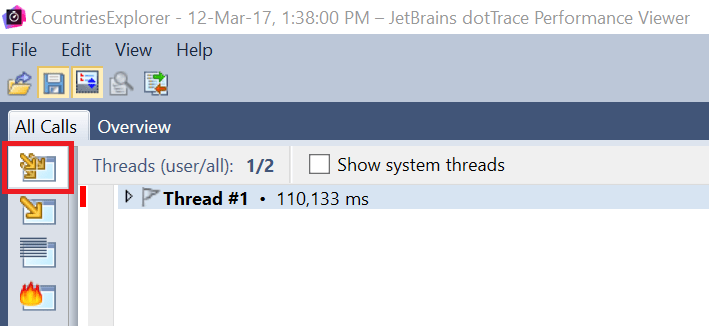
In this section we normally see all the threads running within our application during profiling time. We had only one thread, so let’s expand the details to see the time and percentage duration of particular calls from the calls stack:

At this moment, without even opening the code, we already see that method called GetAllEuropeanCountries takes 83.63% of our thread’s execution time. What’s more, we can see that this method is defined in CountriesCitiesDbService which apperently retrieves list of European countries from the database or some external source.
The most percipient of you probably noticed there is Thread.Sleep(Int32) method called one level down – yes, that’s for example’s purposes 🙂 , but in real world this would be a database query or a web service call here. The most important is that we know what takes the longest during our operation. Let’s now fix it!
Fixing the issue
Let’s open CountriesCitiesManager solution and use the knowledge we already have from the profiling. We go to the AddNewCity(String, String) method, in which the method for getting countries was called (this is deductible from the calls tree in performance viewer). Here’s the code:
This file contains hidden or bidirectional Unicode text that may be interpreted or compiled differently than what appears below. To review, open the file in an editor that reveals hidden Unicode characters.
Learn more about bidirectional Unicode characters
| private bool AddNewCity(string cityName, string countryIso) | |
| { | |
| var city = CountriesCitiesDbService.GetNewCity(); | |
| var europeanCountries = CountriesCitiesDbService.GetAllEuropeanCountries(); | |
| var country = europeanCountries.FirstOrDefault(ec => ec.IsoCode.Equals(countryIso)); | |
| if (country == null) | |
| throw new ArgumentException($"Country with ISO Code {countryIso} does not exist!"); | |
| city.Name = cityName; | |
| city.Country = country; | |
| CountriesCitiesDbService.SaveCity(city); | |
| return true; | |
| } |
AddNewCity method is called every time the “Add city” button is pressed. In line number 4. we are getting the list of all 46 European countries:

How probable it is that the number of countries in Europe changes during our application’s runtime? Very close to 0, I’d say. So there is totally no sense in retrieving the list of EU countries (from the DB, web service or whatever) every time the button is clicked!
We need to cache this list somehow. Let’s simply extract the variable for storing EU countries as read-only class property initialized only when used for the first time:
This file contains hidden or bidirectional Unicode text that may be interpreted or compiled differently than what appears below. To review, open the file in an editor that reveals hidden Unicode characters.
Learn more about bidirectional Unicode characters
| private List<Country> _europeanCountries; | |
| public List<Country> EuropeanCountries => | |
| _europeanCountries ?? (_europeanCountries = CountriesCitiesDbService.GetAllEuropeanCountries()); |
and use it in AddNewCity method:
This file contains hidden or bidirectional Unicode text that may be interpreted or compiled differently than what appears below. To review, open the file in an editor that reveals hidden Unicode characters.
Learn more about bidirectional Unicode characters
| private bool AddNewCity(string cityName, string countryIso) | |
| { | |
| var city = CountriesCitiesDbService.GetNewCity(); | |
| var country = EuropeanCountries.FirstOrDefault(ec => ec.IsoCode.Equals(countryIso)); | |
| // the rest of method's code… | |
| } |
When the application is now launched, sampling started and button clicked 3 times, we already see the improvement:

AddNewCity takes 65.96% now. This is average value from all the calls we made, so let’s now perform sampling starting from the 2nd click:

The whole AddNewCity method is now taking only 0.41% of the calls during the operation.
Now, if we want to make Customer’s life beautiful, we’d extract initialization of EU countries list to another thread, so it can happen when the application launches and UI is not frozen. We will however stop here. You get the idea, don’t you ? 😉
Summary
Today we’ve seen how easily – by performing just the simplest profiling session that can be done in dotTrace – it may be to detect what causes real performance issues in .NET application. Of course the example was pretty naive and simple, but I didn’t make it up – many times I’ve already worked with performance issues in production code which were caused by retrieving so called “dictionary” or static data using some API or database connection every time in a loop or repetitive process, which was totally unnecessary. By only implementing some kind of cache (maybe a bit more reasonable than the one we did, which in our case was actually enough), I managed to optimize processes executing time from 3 or 4 hours to several seconds.
Obviously if you’re an experienced developer, you’d probably identify such places in which caching or similar mechanism should be used when writing code. Profiling may however be useful for less experienced programmers or when working with legacy code we didn’t write (or we wrote months or years ago 🙂 ). It doesn’t cost much, except the cost of dotTrace itself, which is a part of ReSharper Ultimate, but this tool is just an example, you are not limited to it. For sure there are many other tools that offer the same (or maybe even more?) functionalities.
What are the tools you use for debugging performance issues ? Maybe you also use dotTrace, but can share some experience in using its other functionalities?


I’ve been using Ants Performance Profiler from Red Gate at work:
http://www.red-gate.com/products/dotnet-development/ants-performance-profiler/
I’d say that I even prefer it to DotTrace. The downside? It costs almost 500$ 😀
Very funny to use Russia in example and to talk about the product from Russia. Yes, Yes, open your eyes, dotTrace, ReSharper, intellij Idea, Rider and JetBrains it’s all come from Russia. And you look at your media and blindly believe them…
@Mrvsoft,
mate, I don’t even care whether these products come from Russia or not. If you don’t like the example, just replece Russia with your country of choice and re-read the post 😉
Thanks!
Dawid